
Data & video analysis
Data that tells you what to do next.
Feeling fast and being fast aren’t the same thing. GPS data and onboard video show exactly where the time is, and the report turns it into one clear step for your next session.
02 · Data & video analysis
Data and video analysis: see the lap, not just feel it
Your session on GPS video and data, gone through corner by corner: braking points, minimum speeds, when the throttle comes back, and the ideal lap built from your best sectors.
- Racelogic VBOX video and data on every coached session
- Your lap against a reference lap, corner by corner
- Ideal lap from your best sectors: the time you already have in you
- Remote analysis: send your .vbo or Pi Toolbox files
Apex Telemetry
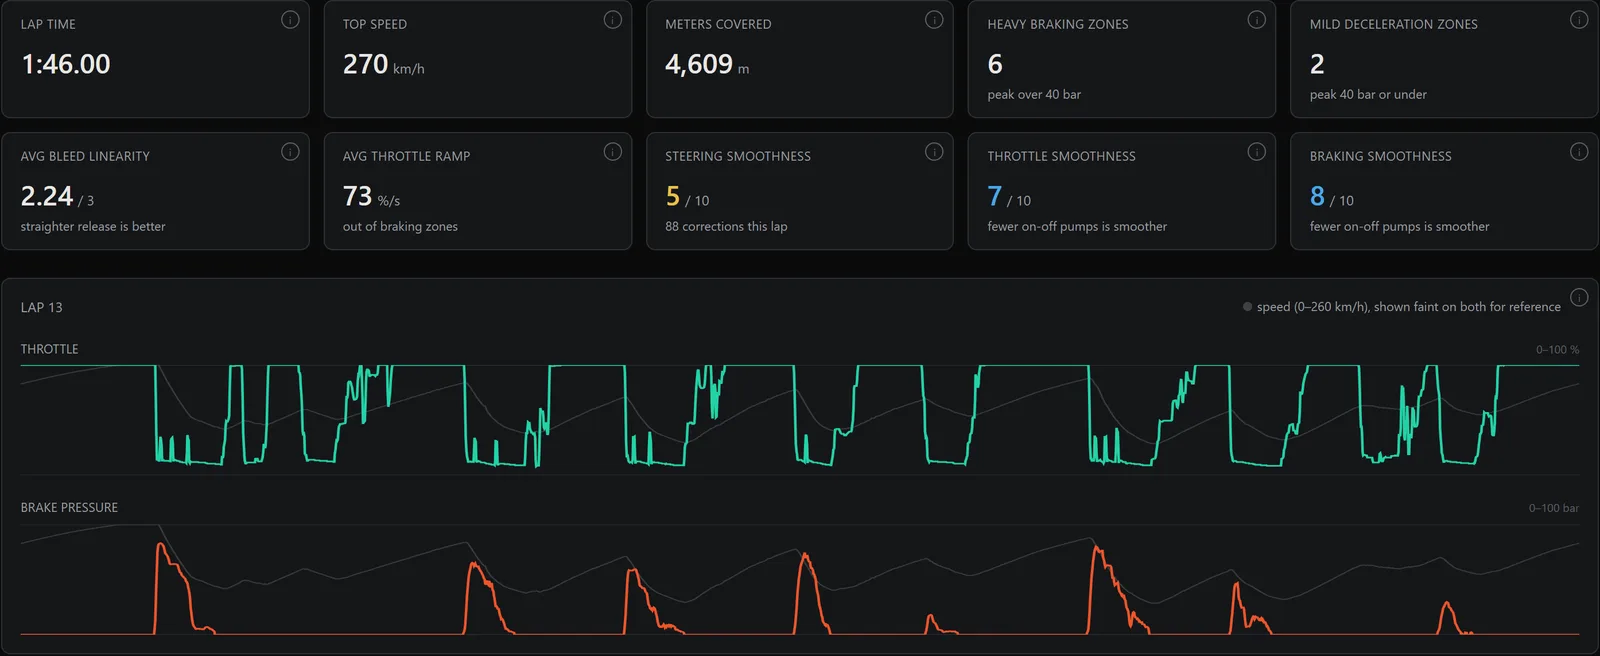
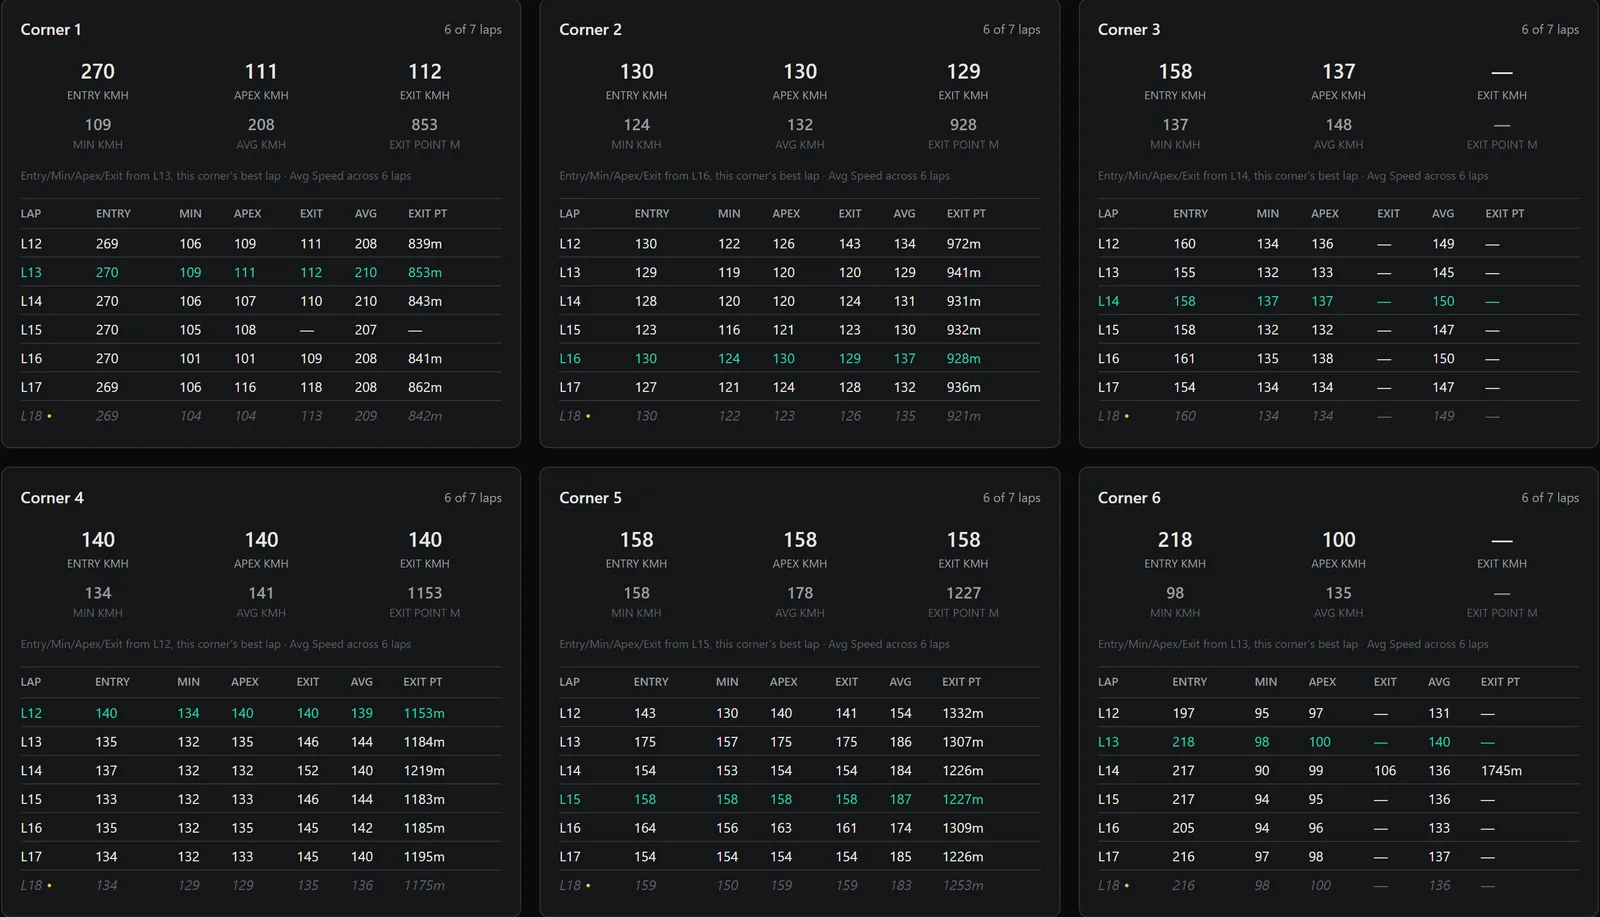
Inside the analysis: a real session at Barcelona
Every corner, every lap: entry, minimum and exit speed, where you get back to full throttle, and which lap was your best through each corner. The software is my own, built for coaching.
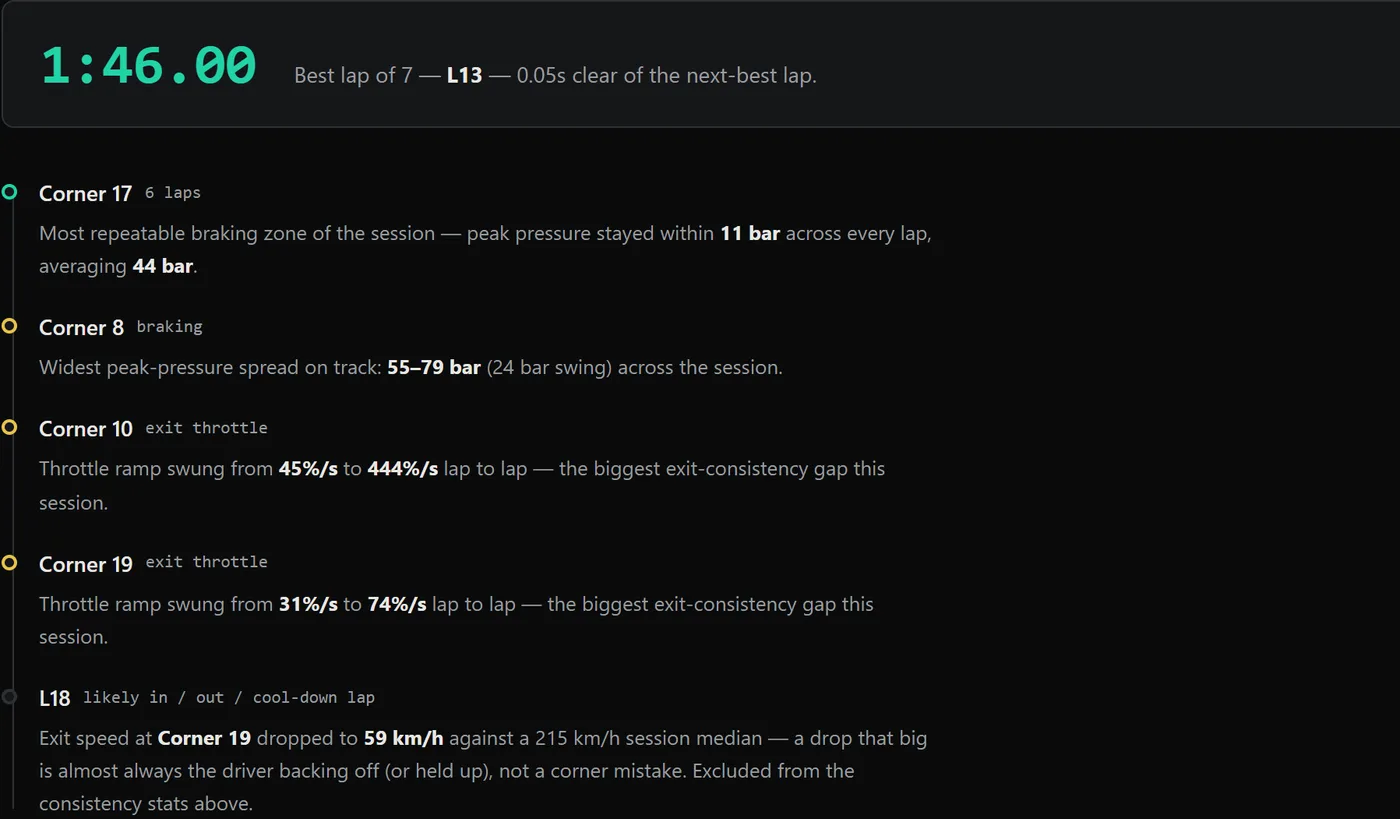
From numbers to one clear next step
The session story picks out what matters: your most repeatable braking zone, where your braking pressure varied most, and where your exit throttle was inconsistent from lap to lap. That becomes the plan for your next session.
Session report
Sample · Spa-Francorchamps · Session 3
1
La Source
Brake in a straight line, release slowly to the apex.
2
Eau Rouge / Raidillon
Set the car before the compression; stay flat over the crest.
Action for next outing
Brake 10 m later at Les Combes and carry the speed to the second apex.
03 · Session reports
A written report after every outing.
What we talk about in the pit lane doesn’t get lost. After each session you get a PDF with notes for every corner, your best lap, the onboard video and photos, and one clear Action For Next Outing to take into the next session.
Notes are recorded trackside, by voice if needed, so the report is ready while the car cools down.
Remote analysis
Drove without me? Send your files and get the same corner-by-corner analysis and written report.
- Racelogic VBOX (.vbo) with video
- Cosworth Pi Toolbox
- Other loggers on request
Price
€200
Per hour of analysis, report included. Prices exclude Belgian VAT (21%).
Partners



Ready to go faster?
Tell me your car, your track and what you want to improve. I’ll come back with a plan.